Telemetry Review
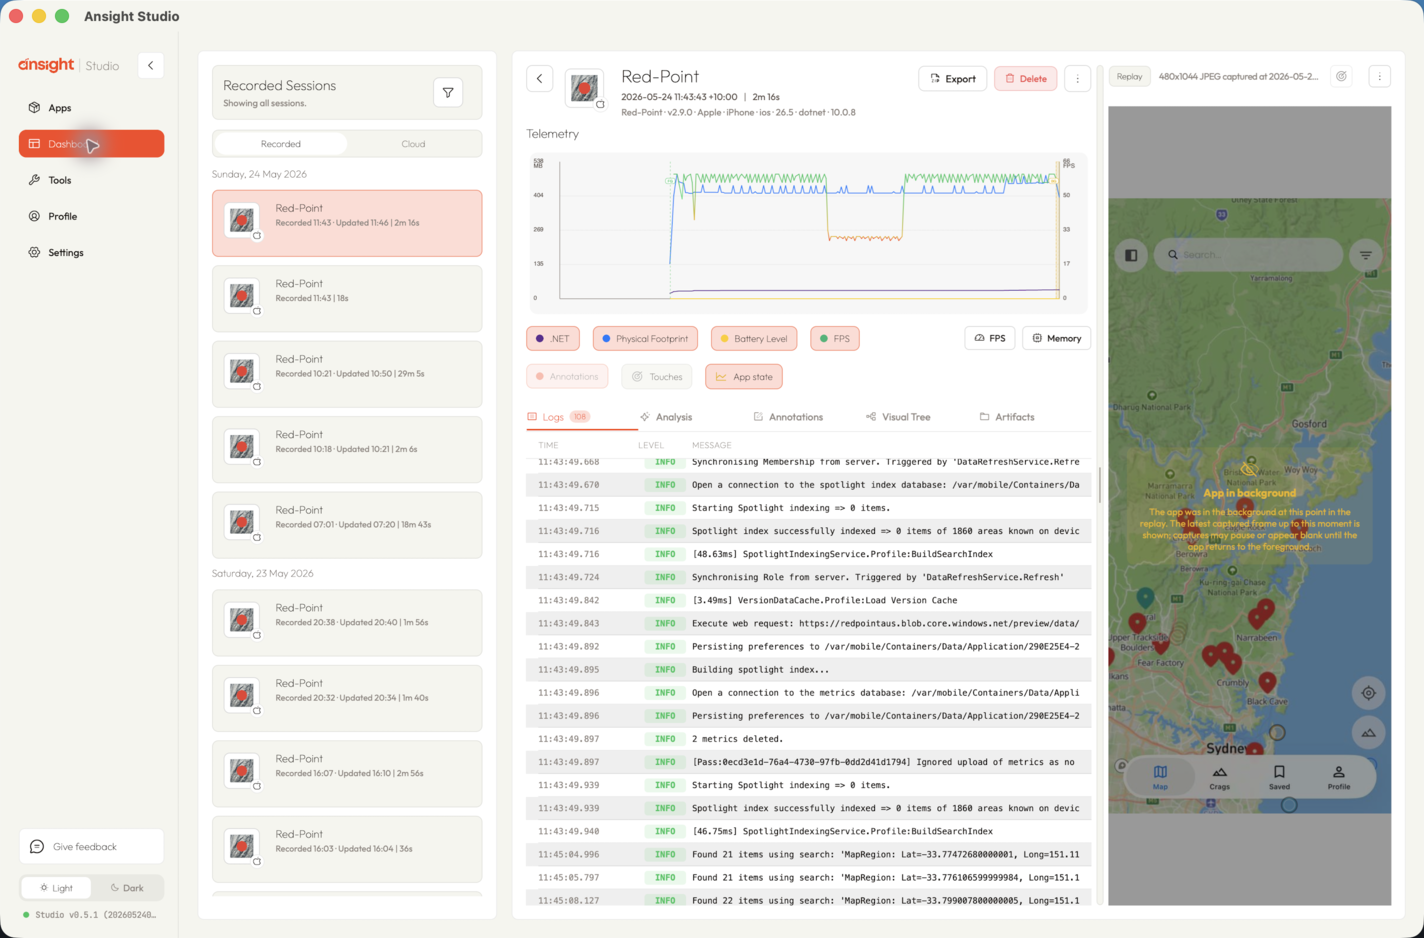
Review FPS, memory, battery, lifecycle, and custom telemetry in Ansight Studio alongside logs, screenshots, touches, annotations, and artifacts.
Telemetry review lets Ansight Studio show app behavior as time-series evidence instead of isolated events. It is useful for performance, lifecycle, and state investigations.
Telemetry Sources
Depending on SDK configuration, Ansight Studio can capture telemetry such as:
- FPS and frame timing
- memory usage
- battery level
- app lifecycle state
- custom telemetry channels
- sampled counters or gauges emitted by the app
Telemetry is stored with timestamps so it can be compared with logs, screenshots, touch input, and annotations.
Reviewing Trends
Telemetry timelines help answer questions such as:
- Did memory climb during this flow?
- Did FPS drop after a navigation event?
- Did battery or lifecycle state change before an issue?
- Which telemetry channels changed near a screenshot, log, or gesture?
Use telemetry windows when you need summary statistics over a time range, and use the full timeline when trend shape matters.
Related Agent Tools
Agents use Evidence and Artifacts MCP tools for telemetry summaries and timelines, and Session Inspection MCP tools for raw telemetry samples.